Content Marketing ROI Measurement in Healthcare Organizations
Standard analytics miss 95% of healthcare patient journeys, rendering most ROI claims meaningless.

Seventy-seven percent of patients search online before booking an appointment. What that statistic obscures is everything that happens between the first search and the actual visit.
The journey almost never moves in a straight line. A patient reads a hospital blog post about knee replacement recovery timelines. Months pass. They mention it to their primary care physician, who writes a referral. The referral gets logged. The blog post vanishes from the attribution record entirely. The content that primed the whole decision, that gave the patient the vocabulary to ask the right question in the exam room, registers as zero value.
Phone calls compound the problem. Eighty-eight percent of healthcare appointments are still scheduled by phone. Callers convert at rates somewhere between ten and fifteen times higher than web form submissions and stay longer as patients. Most marketing analytics platforms cannot see any of that. At all.
The discovery environment is shifting in ways that make this worse. A significant portion of informational health queries now surface AI-generated answers before organic results. Patients find providers through large language models and voice assistants, then navigate directly to the organization's website. That traffic shows up as "direct." No source, no campaign, no content credited. A quarter of patients report being directly influenced by AI-generated review summaries when choosing a provider, placing that channel nearly on par with physician referral influence in certain demographics. Nobody budgeted for that three years ago.
A measurement framework tracking web sessions and form fills is capturing, at best, the last five percent of a patient's decision process. The educational articles, condition guides, and videos that answered the question the patient was afraid to ask their doctor: invisible. Any ROI model built on final-click data is not measuring content performance. It is measuring branded search, and calling it content.
The measurement model has to mirror the full journey: awareness and education at the top, nurture and trust-building in the middle, conversion and scheduling at the bottom. Each stage requires different signals. Collapsing all of it into a single conversion event produces a number that feels clean and means almost nothing.
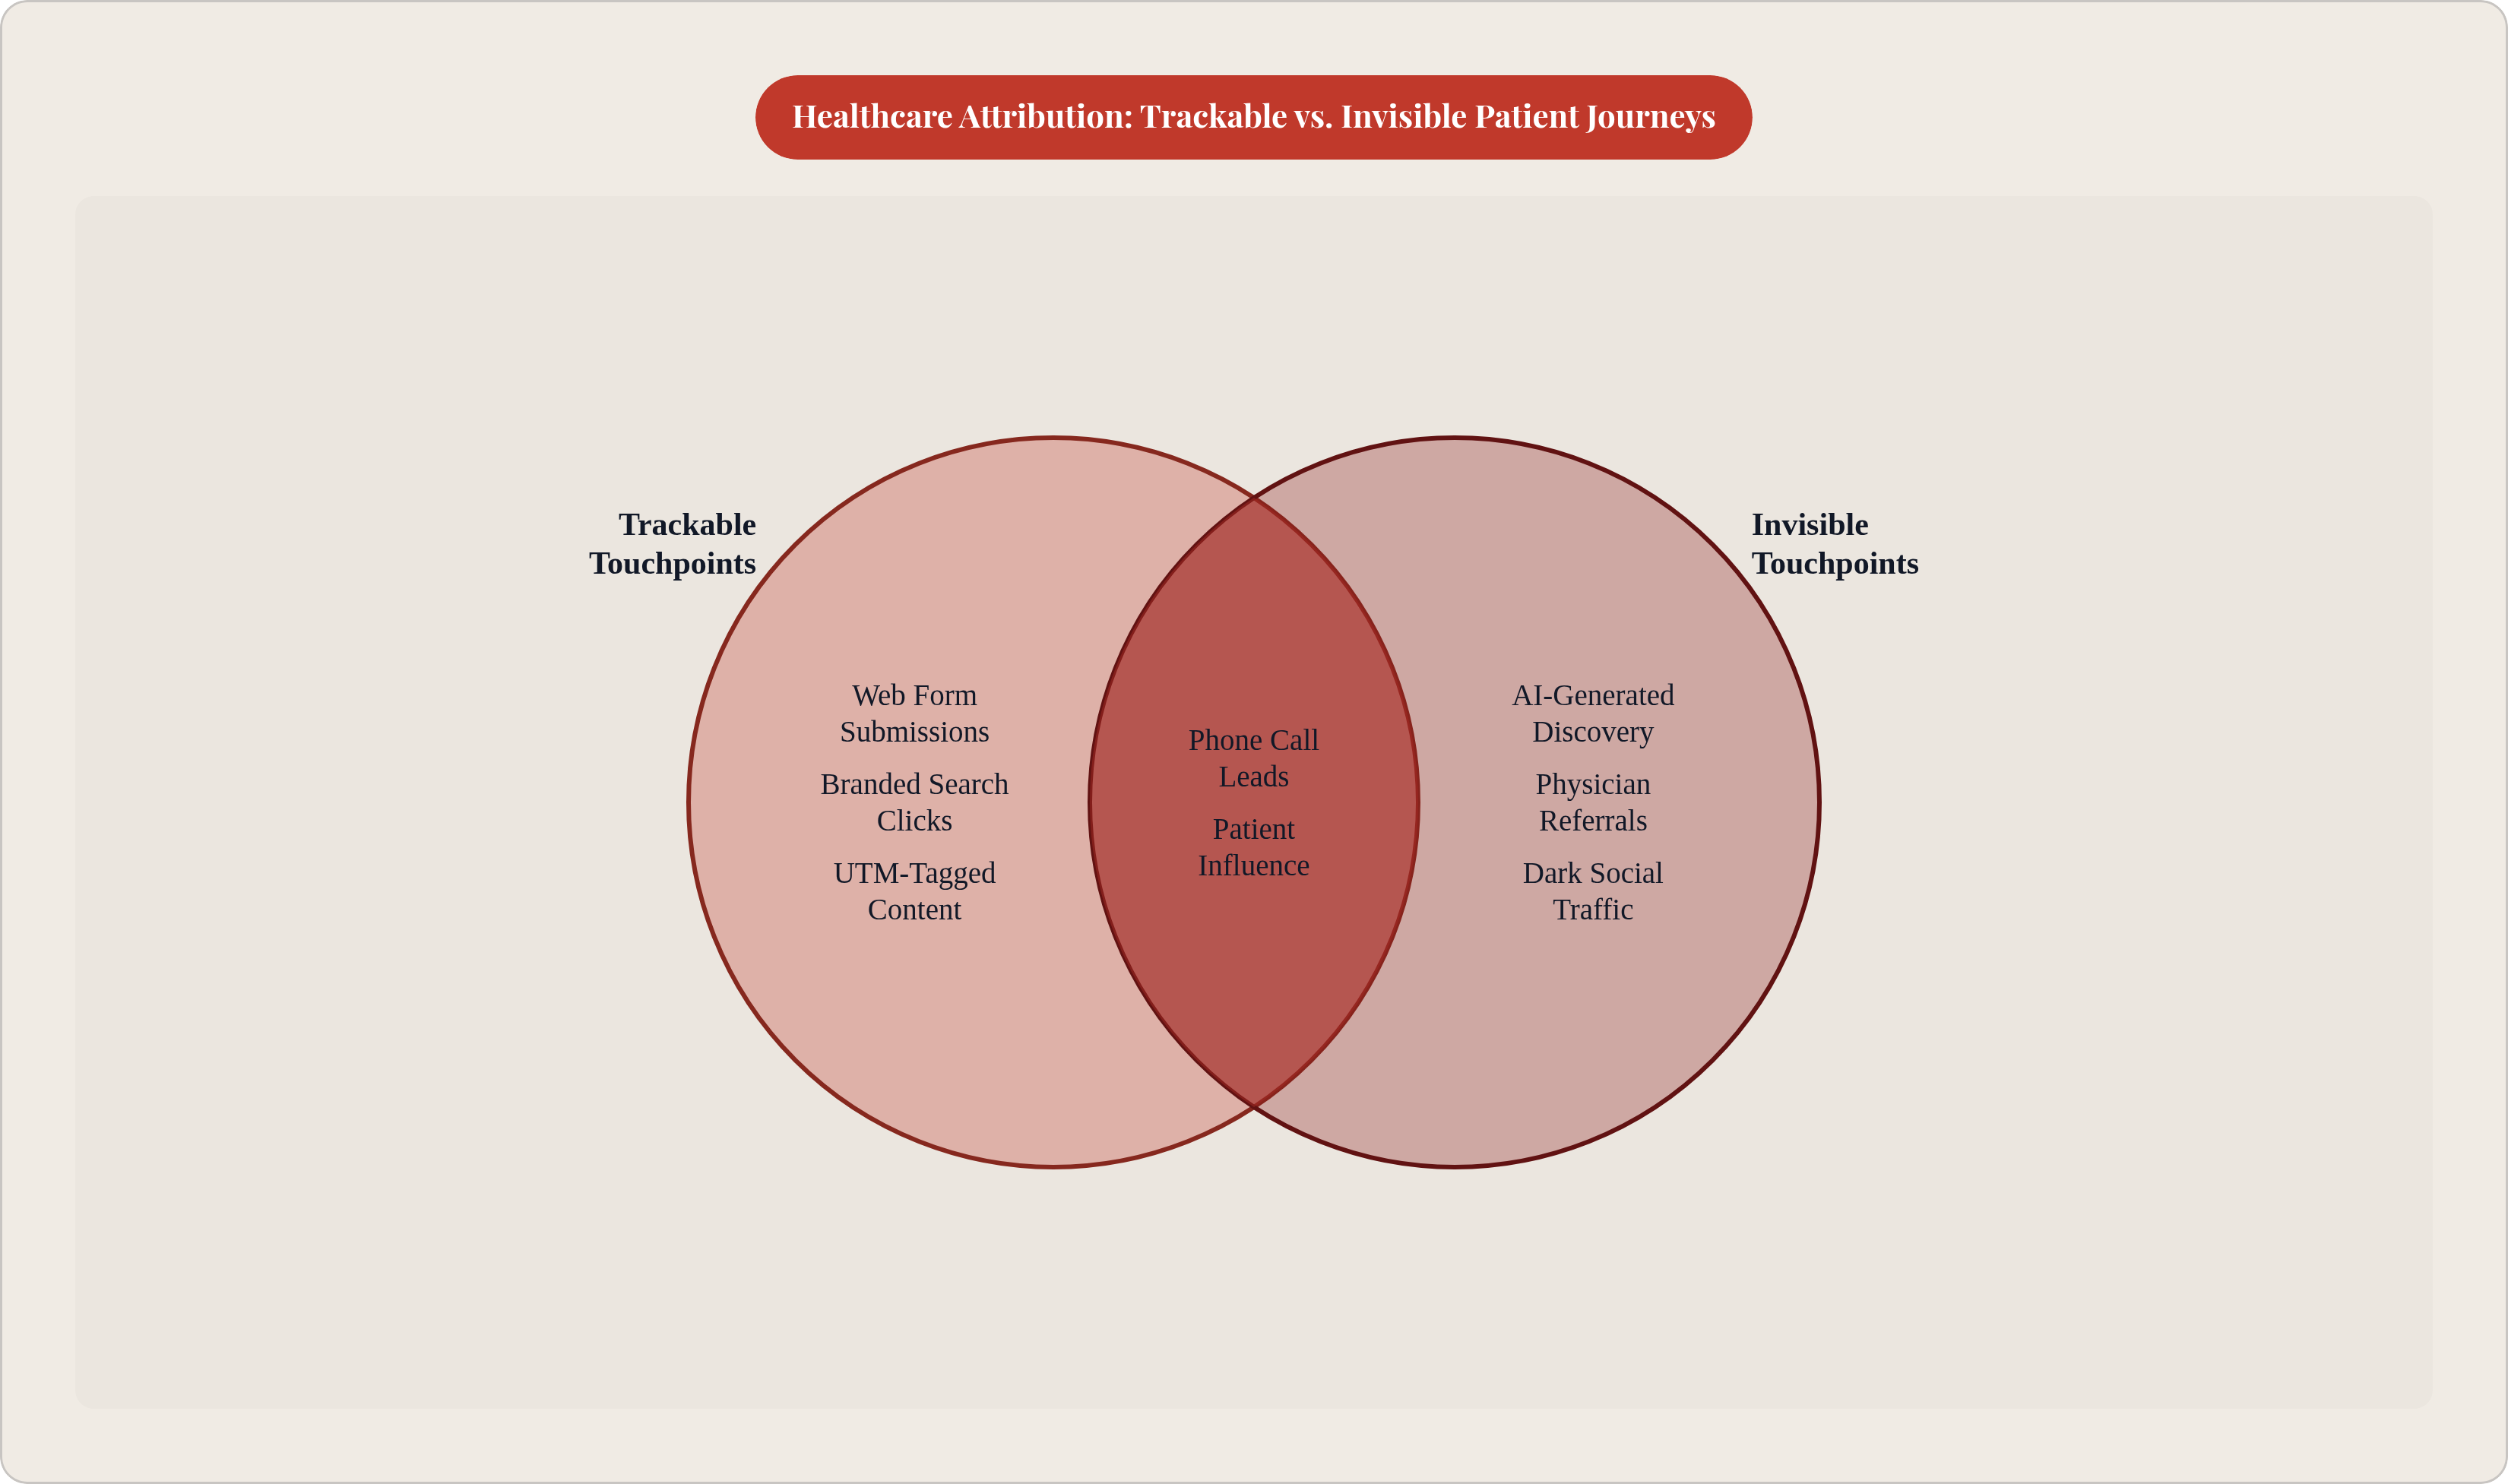
The Six Structural Reasons Healthcare Attribution Breaks Before It Starts
These are not edge cases or unusual configurations. Most healthcare organizations are running some version of all six of these failure modes at the same time, usually without realizing it.
Offline Conversion Blindness
Forty to sixty percent of healthcare conversions happen via phone. Standard analytics infrastructure has no mechanism to connect those calls to the content or campaign that generated them. The result is a systematic undercount of every digital touchpoint that preceded a phone inquiry. The channel driving the most valuable patients leaves no trace.
Physician Referral Invisibility
In specialties like oncology and neurosurgery, the overwhelming majority of patients arrive through physician referral. Standard attribution systems credit the referral and capture none of the marketing activity that shaped the referring physician's awareness or the patient's stated preference before they walked into the PCP appointment. The influence existed. The data did not bother to show up.
Disconnected Systems
Marketing teams live inside ad platforms and CRMs. Clinical teams live inside EHRs like Epic and Cerner. Different identifiers, different data schemas, different access controls, different organizational incentives. Mapping a marketing lead to a clinical outcome is not a dashboard configuration; it is an integration project that routinely runs past eighteen months and requires IT, compliance, and vendor cooperation to align simultaneously. Organizations that budget six months for this routinely find themselves renegotiating timelines a year in.
Last-Click Distortion
Last-click attribution rewards the final touchpoint before conversion. In healthcare, that is almost always branded search or direct navigation. Educational content, condition guides, and blog posts disappear. The content that built provider preference weeks before a patient ever searched by name receives exactly zero credit, every time.
AI Search and Dark Social
When a patient discovers a hospital through an AI-generated answer and then types the URL directly, that visit looks like organic direct traffic. As AI-generated overviews dominate an increasing share of informational health searches, this pool of unattributable direct traffic keeps growing. The content that informed those AI answers, often the hospital's own published articles, receives no credit in any standard analytics report.
Compliance Restrictions
OCR guidance issued between 2023 and 2025 materially changed what healthcare organizations can legally track online. Pixel-based tracking on appointment booking pages and condition-specific pages constitutes an impermissible disclosure of protected health information in many configurations. Some organizations have stripped tracking from high-conversion pages not as an oversight, but as a legal necessity. They are operating with deliberate gaps in their data, and that is the correct response to the regulatory environment, not negligence.
The combined effect of these six failures cannot be solved by adopting a better tool. Perfect attribution is not achievable here. The goal has to shift toward building the most defensible approximation possible within real constraints, and designing workflows that function despite the gaps, because the gaps are permanent.
The Core Metrics Hierarchy: From Vanity Indicators to Financial Outcomes
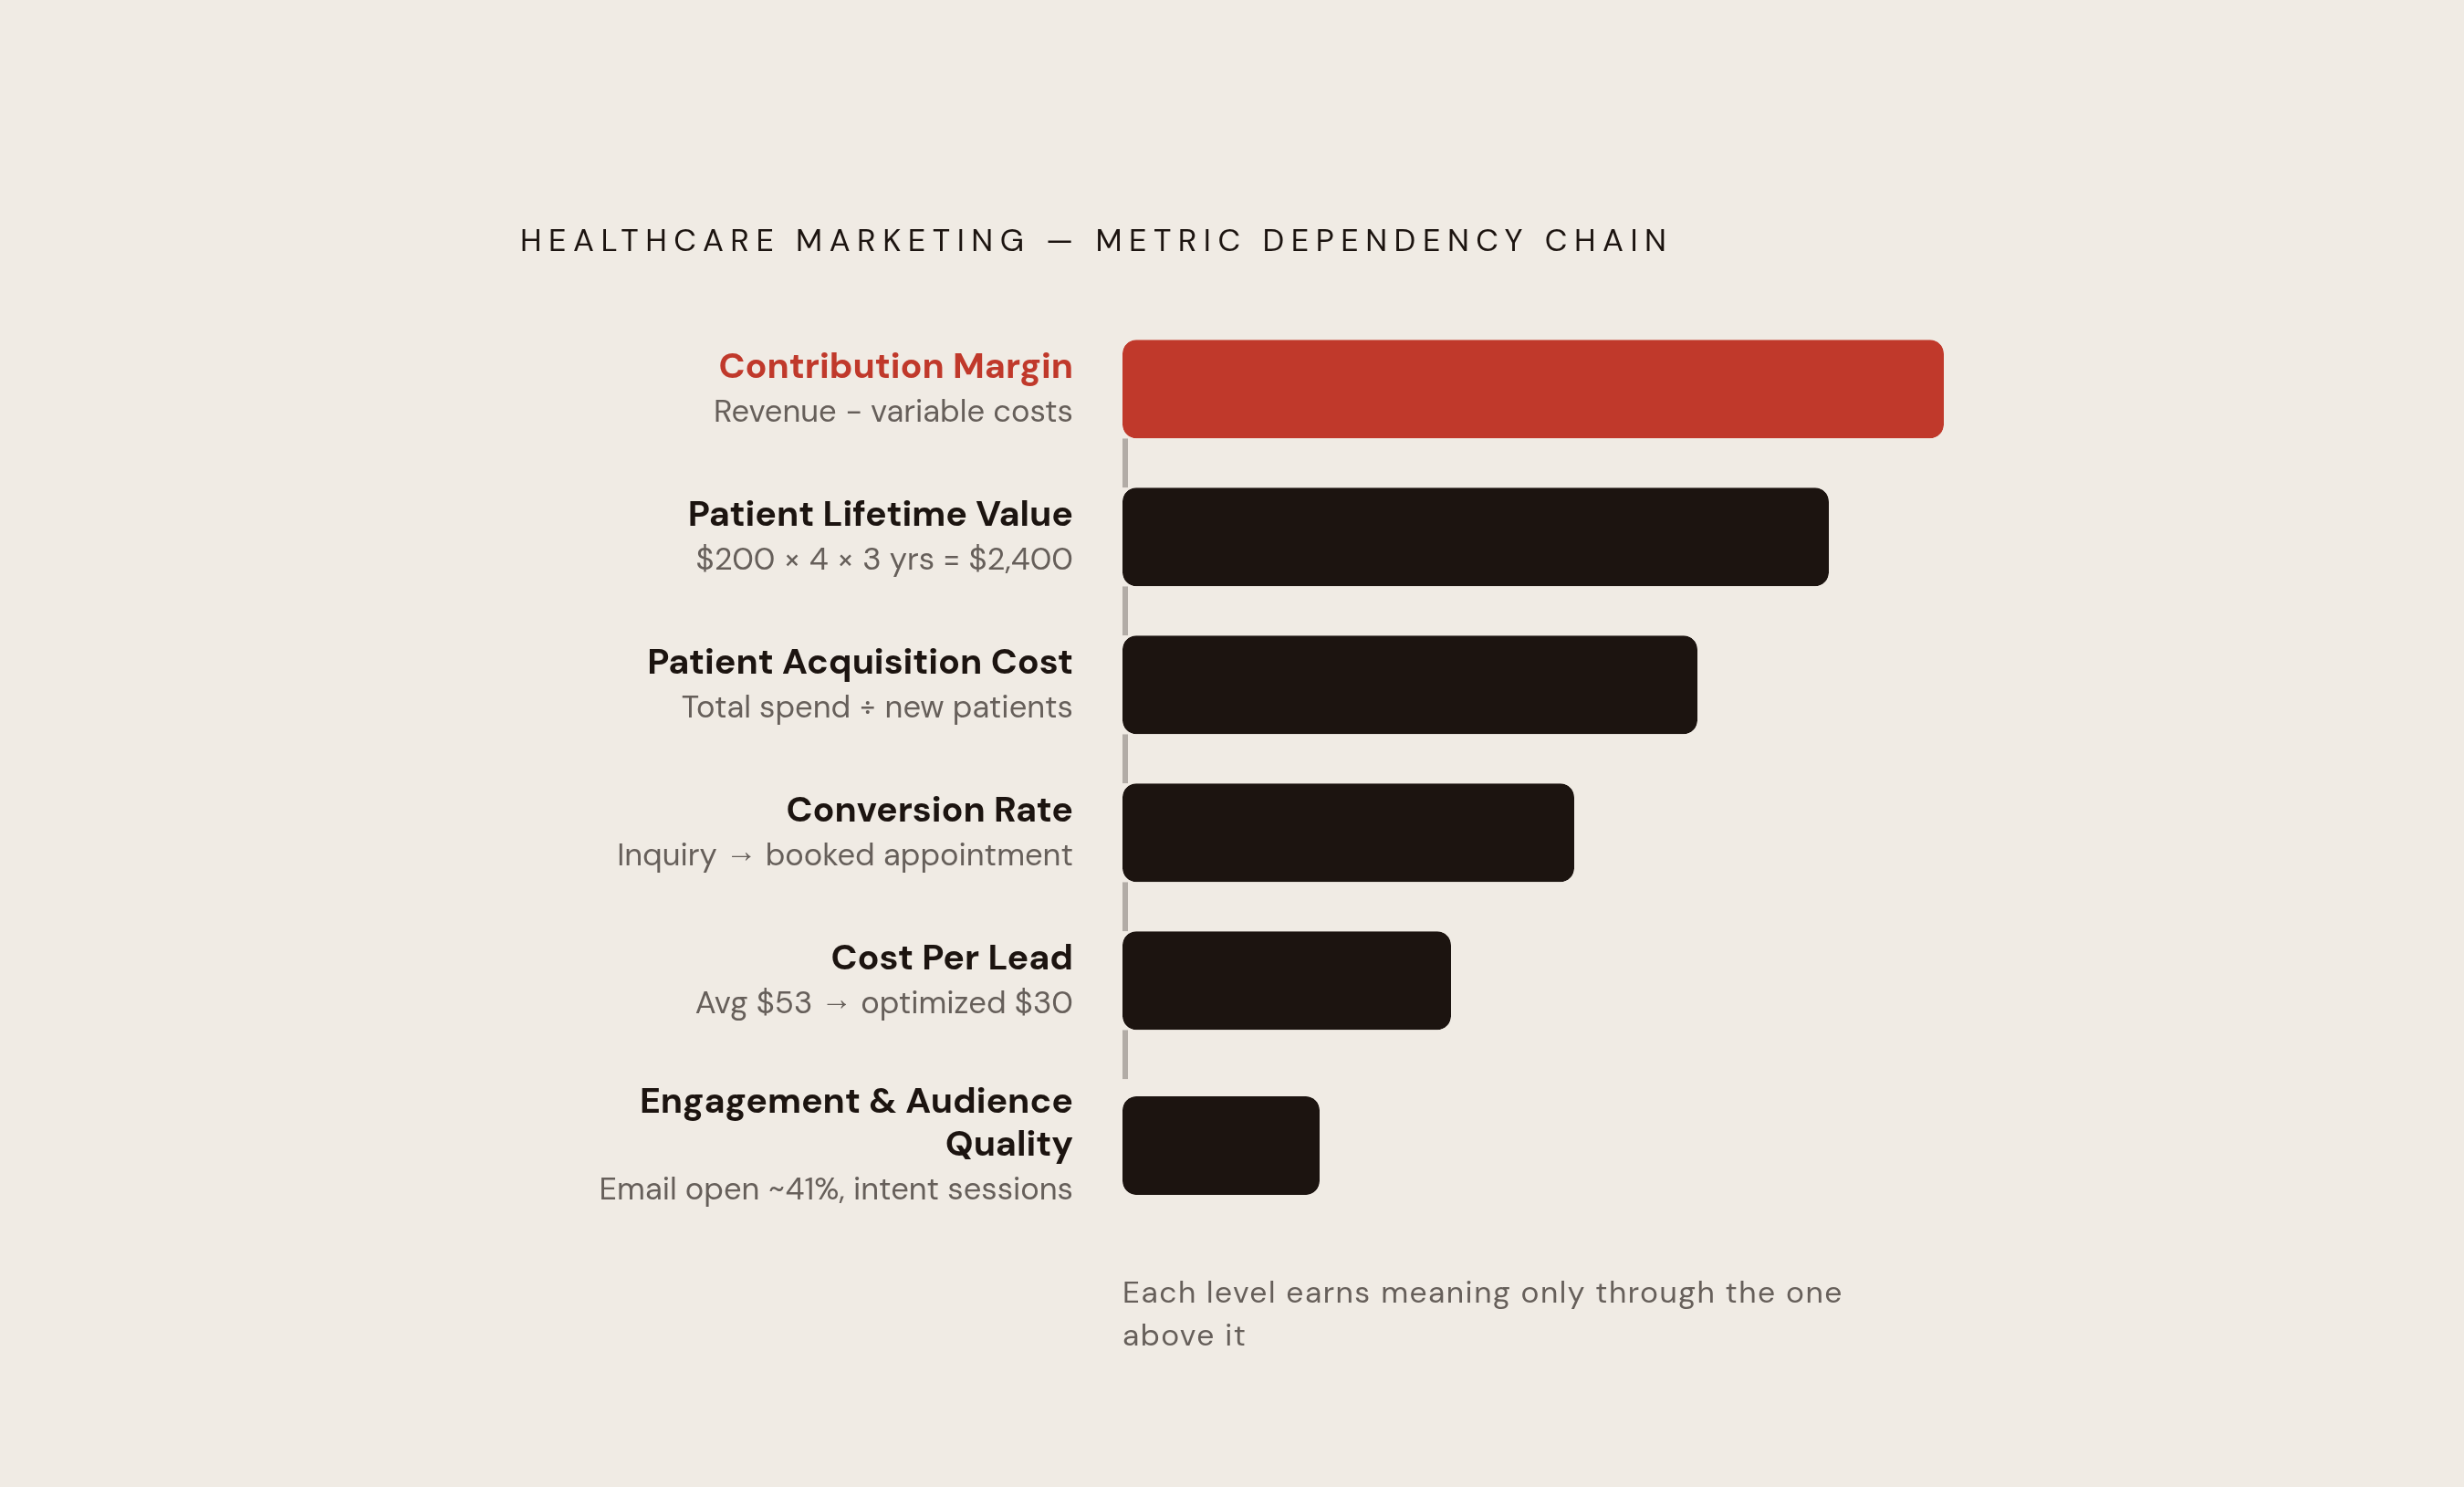
Think of this as a stack. Each metric earns its position by connecting upward to the next, until the chain terminates in something finance and leadership actually use. Treating these as parallel options and selecting whichever look best in a slide deck is how organizations end up with reporting that impresses no one who controls a budget.
Engagement and Audience Quality
Time on page, return visits, content downloads, email open rates: directional signals, not evidence of ROI. Healthcare email open rates average around 41 percent, which is a useful benchmark and largely meaningless without downstream conversion data attached to it.
What matters more than volume is audience composition. A thousand sessions from patients actively researching a specific procedure in your service area is worth more, by a significant margin, than ten thousand sessions from a geographically dispersed general audience with no demonstrated intent. Engagement metrics only become meaningful when segmented by the patient populations that actually generate revenue.
Cost Per Lead
CPL is the first financially relevant metric in the stack. It measures spend required to generate a single patient inquiry, whether via web form, tracked phone call, or chat. Average CPL across healthcare channels sits around $53; organizations running disciplined campaign optimization get closer to $30.
CPL must be broken out by channel and campaign. Aggregate CPL is almost always misleading. It averages the performance of your best content against your worst and tells you nothing actionable about either.
Conversion Rate
This is the percentage of inquiries that become booked appointments. It closes the gap between lead generation and actual revenue. What most marketers underestimate is how much conversion rate is controlled by factors outside their jurisdiction: speed of follow-up, whether calls are answered live, intake staff training, appointment availability. A measurement framework that attributes poor conversion to content is usually misdiagnosing the problem. The content got the patient to the phone. What happened next is an operations problem.
Patient Acquisition Cost
PAC is total marketing and sales spend divided by new patients acquired. This is what leadership and finance actually use to evaluate marketing's contribution. But PAC without context is inert. A four-hundred-dollar PAC is excellent for a surgical procedure and catastrophic for a wellness visit that reimburses at ninety dollars. The metric only functions when placed alongside service line revenue.
Patient Lifetime Value
LTV is the metric that converts content marketing from a cost center into a capital allocation question. Average treatment value multiplied by expected visit frequency over the duration of the patient relationship. A patient spending two hundred dollars per visit and returning quarterly for three years represents $2,400 in LTV.
LTV varies substantially by payer type and service line. Content targeting commercially insured patients for high-reimbursement procedures can justify CPLs that would be completely indefensible in a different context. Without LTV segmented at that level of specificity, channel allocation decisions are being made without the most important variable in the model.
Contribution Margin
Revenue minus variable costs. This is the bridge between marketing's metrics and the finance team's P&L view. Presenting CPL to a CFO is the equivalent of speaking a language they do not use. Presenting contribution margin per patient acquired, by service line, is speaking theirs. Getting to this number requires collaboration with finance, which in turn requires credibility with finance, which is earned by showing up with the full metrics hierarchy intact below it.
Attribution Models That Work Given Healthcare's Structural Constraints
No attribution model is a clean fit for healthcare. The actual objective is selecting the least-wrong model for the specific decision at hand, then being honest about what it cannot see.
Why Last-Click Fails Healthcare
Last-click systematically rewards proximity to the moment of decision. In healthcare, that means branded search and direct navigation collect most of the credit while educational content collects almost none. The model does not measure content value; it measures which touchpoint happened to be standing closest to the conversion. For organizations investing heavily in top-of-funnel education, last-click produces a financial case for content that is structurally understated, not occasionally, but by design.
Multi-Touch Attribution as the Baseline Standard
Multi-touch attribution distributes credit across all trackable touchpoints in the patient journey: content discovery, email nurture, retargeting, branded search. Linear allocation gives equal credit across all touches. Time-decay allocation weights recent touchpoints more heavily. Position-based allocation concentrates credit at the first and last touches with shared weight across the middle, which works well for service lines with distinct awareness and decision phases.
The operative word throughout is "trackable." Multi-touch attribution cannot assign credit to touchpoints it cannot see, which is precisely why call tracking and offline data capture are prerequisites, not additions.
Handling the Phone Call Gap
Call tracking with dynamic number insertion connects inbound calls to the specific campaign, content piece, or channel that generated them. Given that the overwhelming majority of healthcare appointments are still scheduled by phone, this is not optional infrastructure. Without it, every piece of digital content that generated a phone inquiry rather than a form fill is categorically excluded from attribution. And because callers represent higher-LTV patients on average, their systematic exclusion does not just undercount conversions; it specifically undervalues the most commercially significant ones.
Handling Physician Referral Influence
Referral influence does not appear in click-based attribution and there is no workaround that captures it fully. The practical approaches are patient intake surveys with a "how did you first learn about us?" field, CRM tagging of referral sources by scheduling staff, and physician liaison tracking for organizations with dedicated referral programs. Some organizations apply a "last non-referral touchpoint" model that credits the marketing asset consumed immediately before the referral was requested. It is an approximation. It is also far more accurate than attributing zero value to months of content that preceded a physician's recommendation.
AI Search and Dark Social
Direct attribution of AI-generated discovery is not possible within standard analytics infrastructure right now. The proxies worth tracking are brand search volume trends, branded direct traffic alongside content investment, and share-of-voice in AI-generated answers for key condition and procedure queries. Rising direct traffic that correlates temporally with content publication is a signal, not proof. It is also the best available signal for a channel that generates no trackable clicks.
Compliance-Safe Tracking Architecture
OCR guidance means appointment booking pages and condition-specific landing pages require tracking configurations that differ materially from the rest of the site. Server-side tagging and consent management platforms preserve measurement capability within compliant parameters. This is a technical and legal configuration decision requiring IT and legal counsel. Organizations that allow marketing to make these calls unilaterally are carrying regulatory and reputational exposure that is easy to ignore precisely because it is difficult to quantify.
Connecting Content to Revenue: The EHR-CRM Integration Problem and Practical Workarounds
The core gap is not subtle. Marketing sees clicks and leads. Clinical operations sees appointments, diagnoses, procedures, and revenue. These two datasets almost never occupy the same system. When organizations attempt to join them, the project takes longer and costs more than anyone initially projected. This happens reliably enough that it should be treated as a planning assumption, not a risk.
EHR integration timelines routinely run seventeen months or longer. EHR schema complexity, IT resource constraints, vendor coordination cycles, and compliance review requirements do not add; they compound. Organizations planning for full EHR integration should budget twelve to twenty-four months and build interim measurement approaches capable of standing independently. The interim approach is not a placeholder. It is the system you will actually be running during the period that matters most.
Interim Approaches That Do Not Require Full EHR Integration
CRM as the measurement hub. Route every inbound lead, web form, tracked call, and chat inquiry into a CRM. Have scheduling staff tag the lead source at the point of booking. Pull appointment and service line data back through manual export or lightweight reporting. It is not elegant. It works, and it requires zero IT dependencies.
Patient intake forms. A "how did you hear about us?" field at registration is low-technology, inexpensive, and consistently underused. Even at sixty to seventy percent completion rates, the resulting data produces attributable patterns that are more accurate than many technically sophisticated alternatives. The barrier is not capability. It is organizational follow-through on a simple process that someone has to own.
Unique phone numbers and UTM parameters per content piece. Assigning distinct tracking numbers and UTM tags to individual articles, landing pages, and campaigns enables granular inquiry tracking at the content level, entirely independent of EHR connection. Deployable in days.
Service line revenue reconciliation. Pull monthly procedure volume by service line from billing. Compare against marketing investment by service line. Calculate PAC and an approximation of ROI at the service line level. This method requires no individual patient-level attribution and can be executed with a spreadsheet and a billing export. It is coarse, but it is honest, and it is far better than reporting nothing while the integration project extends into its second year.
Measure at the level of granularity your infrastructure actually supports. Be explicit with leadership about the gaps. A clean PAC by service line is more useful, and more credible, than a technically sophisticated attribution model that took eighteen months to deploy and reflects market conditions that have since changed.
Building the Measurement Workflow: Cadence, Reporting, and Internal Buy-In
A measurement system without a reporting cadence produces data that accumulates and influences nothing. This is where most measurement efforts quietly collapse, not in the technical architecture but in the operational follow-through.
Reporting Cadence by Metric Type
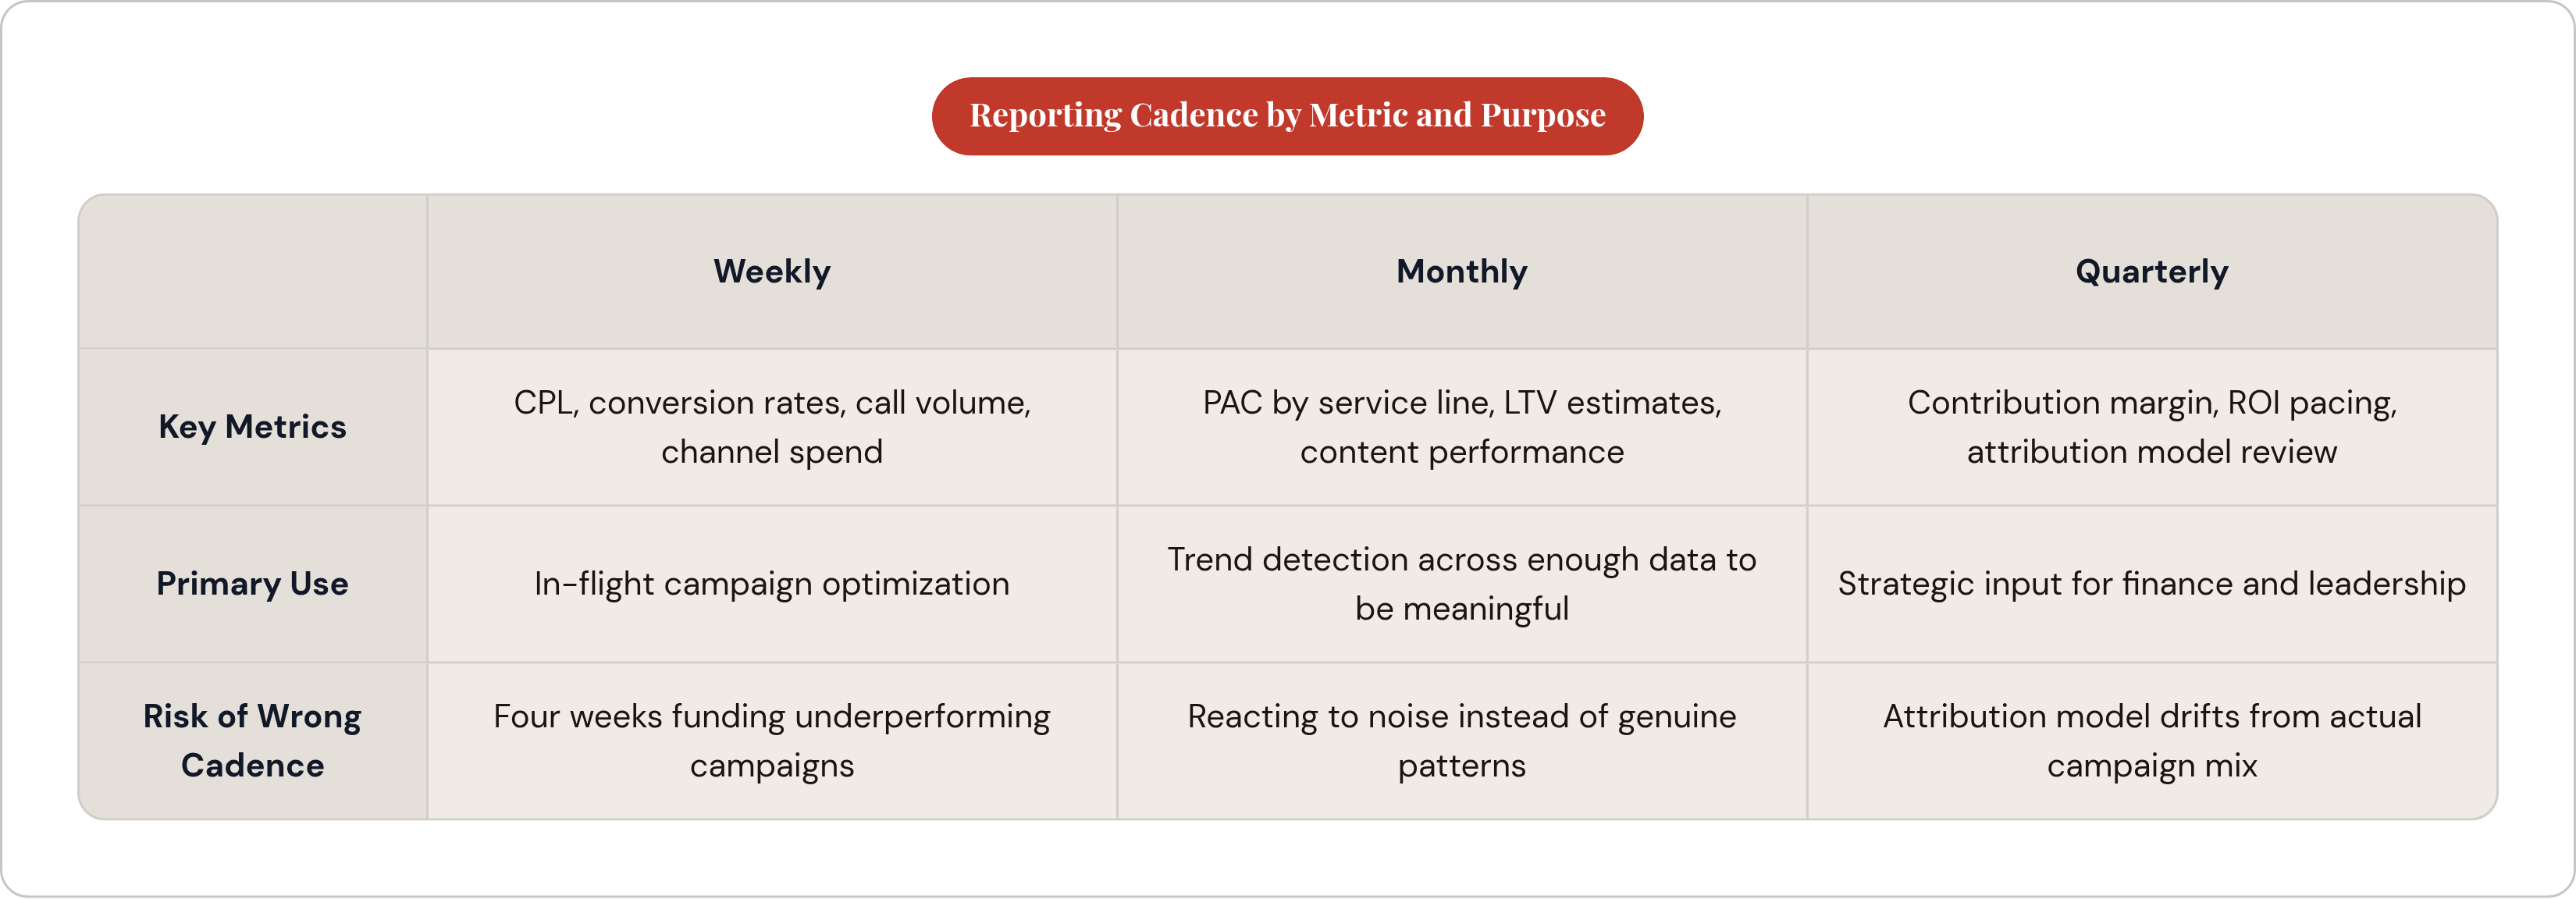
Weekly: CPL, conversion rates, call volume, channel-level spend. These are operational signals for in-flight optimization. Waiting a month to review CPL means spending four weeks funding underperforming campaigns.
Monthly: PAC by service line, LTV estimates, content-level performance. Monthly frequency allows enough accumulation to detect genuine trends rather than statistical noise.
Quarterly: Contribution margin, budget pacing against ROI targets, attribution model review. These are strategic inputs for leadership and finance. Quarterly review also creates natural checkpoints to ask whether the attribution model in use still fits the campaign mix, which changes more often than most organizations revisit their measurement approach.
Translating Metrics for Finance and Executive Audiences
Healthcare content marketing averages roughly a 3.6-to-1 ROI across campaigns, with channel-specific ratios ranging from 2-to-1 to 12-to-1 depending on service line and attribution accuracy. That range is wide enough to be operationally useless without segmentation, but it is a functional anchor point when introducing content ROI to executives who have not encountered the category before.
Finance thinks in margin and payback period. Presenting CPL without connecting it to LTV and contribution margin is the equivalent of presenting the cost of surgical supplies without mentioning what procedure they support. The formula is direct: revenue generated minus marketing cost, divided by marketing cost. Tether that formula to specific service line revenue growth, not total organizational revenue, and the attribution stays defensible.
Building Cross-Functional Alignment
Attribution only functions when scheduling staff, IT, and clinical operations teams are enrolled. They control the data entry points marketing depends on: intake forms, call logging protocols, EHR source tagging. Without their participation, gaps exist that no analytics configuration compensates for.
Monthly data quality reviews are worth institutionalizing. A schema change in the EHR, a staff member who quietly stopped collecting intake source data, a tracking tag that broke during a website update: these mundane failures corrupt months of reporting before anyone notices. Regular reviews also communicate to operational partners that the data they collect is actually being used. People stop doing work that disappears into a void, and they are right to.
Content velocity, the rate at which new content is produced and indexed, functions as a measurement input in its own right. Organizations that publish consistently build cumulative organic visibility that compounds over time. Measuring content output alongside performance metrics creates a feedback loop connecting production investment to audience reach to downstream conversion. The picture is incomplete. It is also more complete than what most healthcare marketing teams are currently presenting to the people who control their budgets.